
When YouTube and Netflix “video-on-demand” arrived on the scene in the mid-2000s, streaming was entertainment’s new frontier. A quarter of a century later, major traditional players like Disney+ and HBO Max have cemented streaming as an established medium. But when it comes to measuring the success of streamed movies or TV shows with real numbers, that’s still a work in progress.
The historic standard bearer for TV ratings, Nielson expanded their traditional system in 2014 to include some streaming data. But what worked to create a comprehensive analysis in the Golden Age of television has more than a few obstacles today.
In the past all you needed to know was the number of viewers, says Nielsen’s SVP of Product Strategy, Brian Fuhrer. The goals were black and white: ad revenue and syndication rights. And for feature films it was the box office. That has all changed with some streaming platforms measuring success by number of subscribers, some by ad revenue, some by hybrids of the two—with no way to measure all the numbers available because content is no longer delivered solely to television screens, and no way to truly compare numbers because streaming platforms’ internal analytics are proprietary. On top of these challenges, there is the issue of online activity related to a piece of content—another way to measure viewership.
While viewers—now in the form of subscribers—are still the brass ring, this is an equation in which “no one has all the variables,” says Fuhrer. Streaming may be fairly straightforward—“any content delivered through the internet … or anything that is app-based,” he says—but the Hulu app on your TV is not the same as the Sling TV app on your iPhone, which is a closed environment, meaning you can’t put a meter on it the way you can on a television set.
In addition, that meter on a TV only gets you so far. “Traditionally we’ve worked closely with all the broadcasters because they’ve worked really hard to make sure everything was always measured,” says Fuhrer. “And all the technology was embedded [right in the television sets]. Now, with streamers, the relationship’s a little different … they like to control the narrative.”
The Metrics
“One of the things we try to be transparent about is what is included [in our metrics], and it is TV only. And U.S. only,” says Fuhrer. Nielsen measures TV viewing in more than 40,000 households. About half of these households are equipped with Nielsen’s Streaming Meter which captures streaming happening on television sets. (Laptops, cell phones, and other digital devices are not measured.)
Like the streaming platforms themselves, Nielsen measures minutes viewed and frequency of views, “but [the streaming platforms] don’t know the people,” says Fuhrer. “That’s what we bring to the table. Who is watching. What their age, gender, education are. Their location, race, ethnicity.”
“… data can only get you so far. At the end of the day, [creators] still have to create a good show. That’s where there’s the balance of the arts and the sciences.”—Renee Engelhardt, Vice President of Partner Insights, Parrot Analytics
Still, Nielsen crunches numbers, and “this is where it gets complicated,” Fuhrer says. “When we look at a program, we determine the average number of people viewing throughout each minute of the program. Then we multiply that by the duration of the program, and it gives us the measurement in viewing minutes. The reason we do this is because content durations vary much more on streaming services versus programs on linear television. This equalizes dissimilar durations between the various content like movies, limited series, programs with 300+ episodes, and so on. We look at minutes to say, ‘Of the time people are spending on a streaming service, which programs are making up most of that time?’”
Nielsen has plans to expand its scope, and new companies are entering the marketplace with different ways to analyze viewing. Then there is a company like Parrot Analytics that measures “how much time in totality audiences are engaging with a show or a movie” beyond actually watching that show or movie on its streaming platform, says Renee Engelhardt, Vice President of Partner Insights. Parrot measures what the company calls “the attention economy.” While this may sound like a slick marketing term, in fact it’s an important indicator of just how dramatically viewing has changed in the way that viewers interact with content.
Based on the premise that time is a finite resource, and that content creators are competing for the finite time of their viewers, Parrot measures the supply (a movie or series) and the demand for it (all of the activity surrounding the supply online). This measurement of demand includes:
- Tracking consumer research of Content X online. This may include Google searches, reading a Wikipedia page, and the like.
- Views of trailers or related videos for Content X on sites such as YouTube and Dailymotion.
- Social media activity and engaging in conversations about Content X.
- Viewing episodes of Content X on open-source P2P (AKA pirated) streaming.
This begs the question: Why does any of this activity matter?
Parrot calls the above activity “signals,” and the company applies a weight to each of the signals, based on the amount of effort it takes to express that signal. For example, “liking” a social media post requires far less effort than watching a trailer or other long-form content. The weighted signals are then aggregated to arrive at the final demand metric. This metric can be used to address numerous factors, such as determining the potential success of a show, how a show measures up in its market, and a show’s staying power.
In the Weeds
 Graphic courtesy of Nielsen.
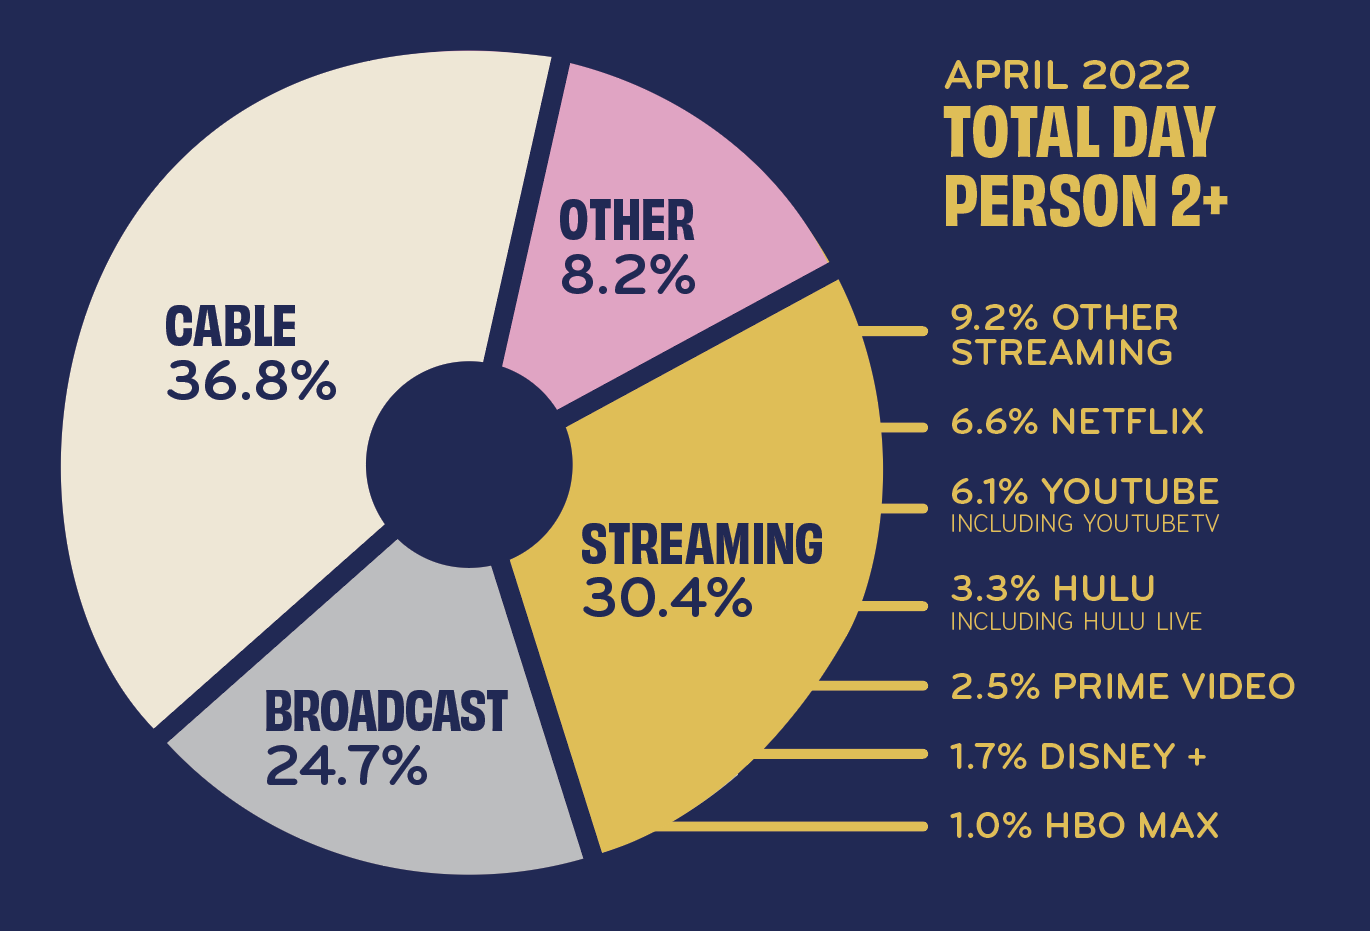
In 2017, Nielsen released its first Subscription Video On-Demand (SVOD) ratings to the public. Then in mid-2021 it introduced The Gauge, a measurement of total TV viewing (broadcast, streaming, cable, etc.) derived from two separately weighted panels:
1. Data for linear sources (broadcast and cable) and usage classified as “other” comes from Nielsen’s national TV panel as a whole.
2. Streaming data comes from a subset of TV households in Nielsen’s national TV panel that are enabled with the Streaming Meter on their television sets.
For the month of April 2022 (see graphic), The Gauge reported that streaming made up 30.4% of all programs viewed on TV sets in Nielsen households. Cable made up 36.8%, broadcast 24.7%, and other 8.2%. Nielsen measures streaming video usage from any and all streaming video platforms. The Gauge graphic indicates streaming platforms that have surpassed the threshold of 1% share of total TV viewing. Streaming platforms that have not yet reached a 1% or higher share are included in streaming’s “other” category.
We know how Nielsen gets its information. Meters attached to TVs. For Parrot, the company collects and analyzes the activities, interactions, and behaviors related to relevant content from over two billion people every day, gathering information from P2P media networks and relevant third-party social networks.
“Demand is calculated on a daily basis,” says Engelhardt. “Even if a show isn’t currently airing, we measure the demand for that show today, and how audiences are still engaging with that content. This then has multiple applications, for example, with licensing or acquisition strategies.”
Another way the demand data is applied is for understanding the market landscape across streaming platforms. “Each platform, such as HBO Max or Netflix, knows the viewership of their shows that are on their platform,” Engelhardt says. “But they don’t really know how that viewership is performing in relation to shows on other platforms. We’re able to provide a macro-level view of the market landscape, of how shows are performing across platforms. Our demand metric is platform-agnostic and market-specific. It’s a single metric that we’re able to apply consistently across all regions of the world. And because we look at it on a per capita basis, we’re able to create an apples-to-apples comparison of how content is performing across different markets.”
The Success Factor
When it comes to the question, what is a success, “there are a lot of different ways to answer,” says Fuhrer of Nielsen’s calculations. “One is total volume. I start off every week when I look at the top 10, and I say, okay, what programs were over a billion minutes viewed. That just gives a bit of a seat of the pants. If something’s over a billion minutes, it’s a big deal.”
This, of course, is an obvious determination, and there are always outliers. Noting how the sweet spot for streaming is nabbing the 18-24 audience, Fuhrer says: “My favorite example is when The Crown first released. I got the data back from The Crown, and I was like, wow, this is a really undesirable audience. Everybody that’s watched The Crown is over 55, you know. Then I thought for a second. If this program is reaching out to a completely new audience, isn’t that a success?”
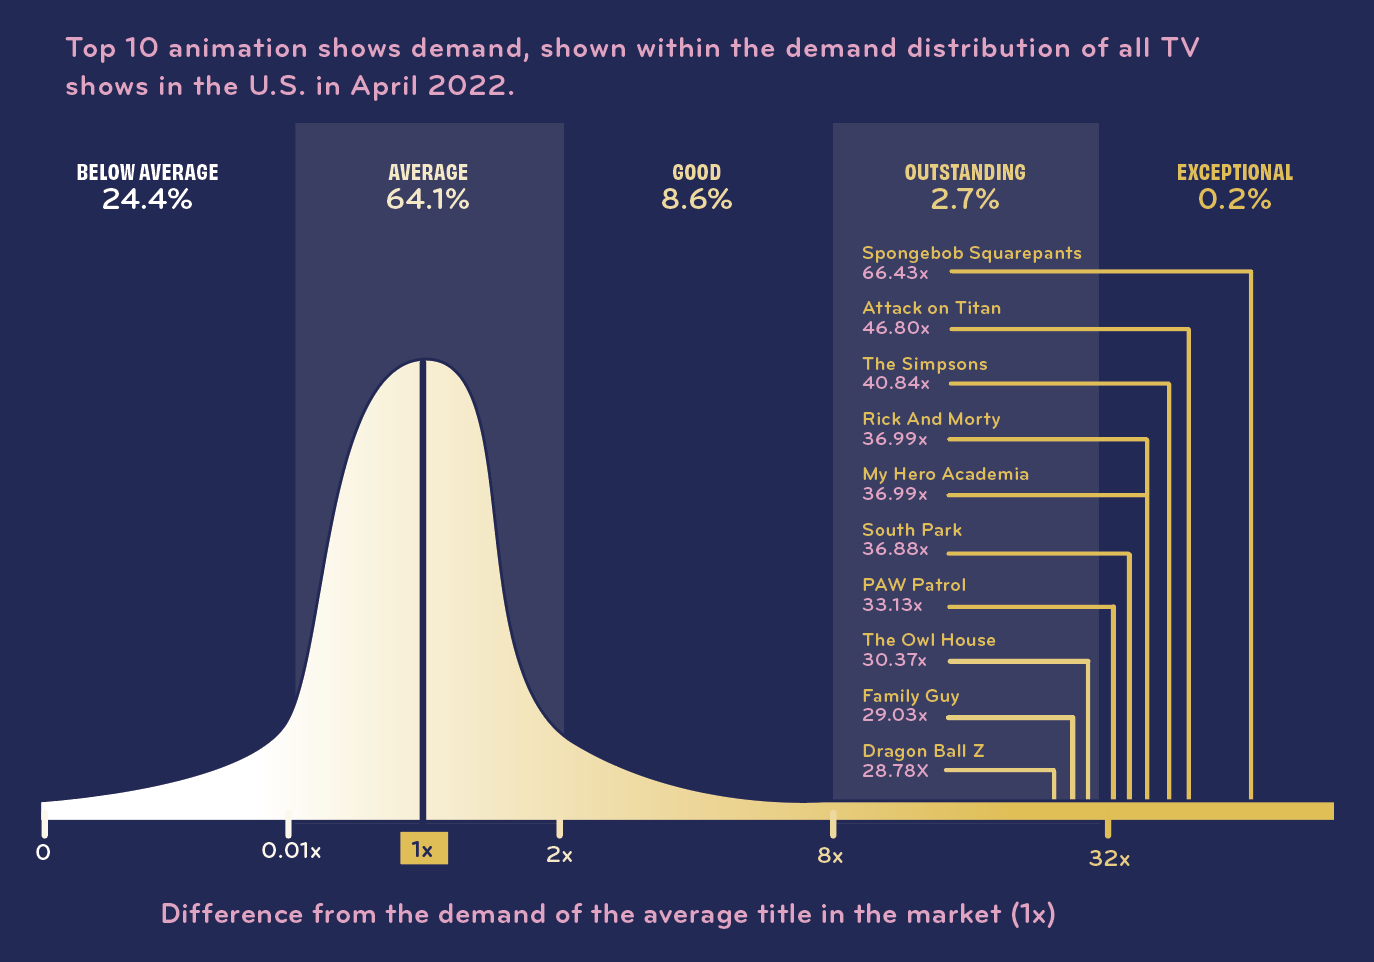
Parrot produces a weekly and monthly ranking of TV shows demand across all television platforms for the U.S. For the month of April of this year (see graphic), for example, SpongeBob SquarePants sat at the top with a number of 66.4x. “It’s no surprise that SpongeBob ranks at the top if you think about the ubiquity of all the SpongeBob videos and memes,” explains Engelhardt, “and the many more signals such as researching, P2P consumption, social signals, and so on, that audiences can engage with. These expressions of demand, weighted and aggregated, net the total demand for SpongeBob, which is then indexed against the average demand for all shows in the market to arrive at the demand score. SpongeBob’s score means that it is 66.4 times more in demand than the average show in the U.S. Pretty huge!”
In this particular analysis, shows fall into four buckets: Average, Good, Outstanding, Exceptional. A score of 66.4x is exceptional. This information can be used to measure a show’s performance and ranking relative to other shows, regardless of which platform or network the shows are available on.
Influencing Strategies
The hardest thing for creators is that they, for the most part, create from a place of love and excitement for their subjects. Streaming platforms, on the other hand, acquire and retain content based almost solely on numbers. No calculation is a sure thing, but these numbers determine their decisions. And even when there’s an exception to a rule, that information can be valuable.
It’s possible for content with a lot of demand to not have comparable viewership numbers. People are engaging with it online, but for some reason they’re not watching it. This lets a streaming platform “identify shows that are either being under-monetized or would be better suited for a different strategy,” says Engelhardt. Then there are the exceptions in the other direction. “Squid Game did zero advertising,” she says, “and it just blew up the scene.”
She notes that different shows require different strategies, from the way they’re recommended to the way they’re marketed and even to the way they’re released. To binge release, weekly release, or hybrid release—that is the question.
“If you have 20 episodes to release and you decide to do them weekly, what you’ll see in our demand metric are spikes at each new episode’s air date. Then you’ll start to see demand decay. If you have a binge release and you dump all the episodes at once, there’s a huge spike initially, and then it’s interesting,” says Engelhardt. “Does demand decay faster? Do shows stay relevant longer because new audiences can find them all at one time? If you’re ultimately trying to maximize the demand of your show, how do you do that, what’s the best strategy?”
To Create or Not Create
So where does this leave creators? How do you stay true to your art when you know it’s going to come up against the numbers game? Nielsen can tell a streaming platform what demographic of people is watching what kind of show, shaping platforms’ decisions about what to acquire. Parrot can leverage characteristics about a show or shows to further analyze demand trends. These characteristics can include the language, country of origin, keywords, themes, and other descriptive factors.
“Let’s say you have two different concepts, Concept A and Concept B,” says Engelhardt, “and you want to know which concept will perform better in the market. We can analyze the characteristics of each of the concepts and model the predicted demand, using the historical demand performance and our vast catalog of titles and their characteristics to inform which show is likely going to be a success.” (When asked for examples, Parrot responded that they cannot be publicly shared.)
Data is also used in a very basic supply-demand equation. Within their sprawling, comprehensive database, Parrot can look at the demand for each genre. “We can see drama has a really high demand, for example, but it’s completely saturated,” says Engelhardt. “There are just so many drama shows out there. Or let’s say adult animation has a really high demand but a low supply. Platforms can use demand to identify whitespaces in their catalog or at the market level … and focus their programming strategies on shows in that genre with a high demand and that will benefit their subscriber acquisition and retention strategies.”
In the end, of course, this all comes back to subscribers. How many new subscribers does a streaming platform have? How many subscribers is it retaining and adding?
And while this may make it seem as if originality is doomed, the bottom line, says Engelhardt, “is that data can only get you so far. Demand and other data points can inform what topics, what genres, what key words have been the most successful for certain types of content. But at the end of the day, [creators] still have to create a good show. That’s where there’s the balance of the arts and the sciences. As much as the sciences can help inform these content creators, then we pass the torch to them to create good content.”